多分类坐标轴-https://help.fanruan.com/finereport/doc-view-2234.html 文档中 11.0.3 版本产品新增功能可实现该方案,故将该方案移至论坛。
1.1 预期效果
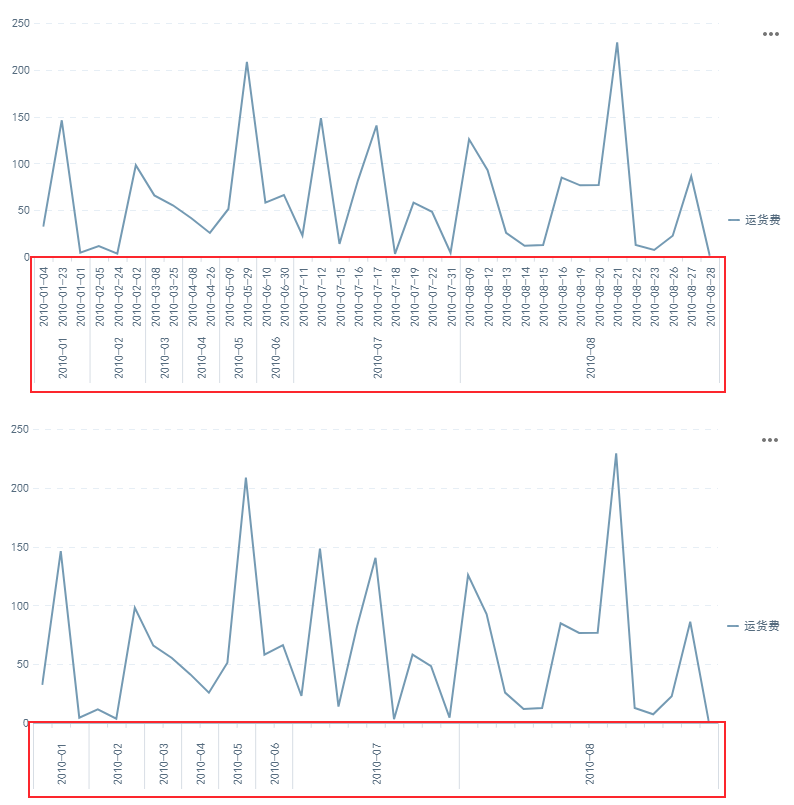
在设计图表时,有时需要绑定双(多)分类,细化数据展示效果,但预览时,只需显示某一个分类的情况。
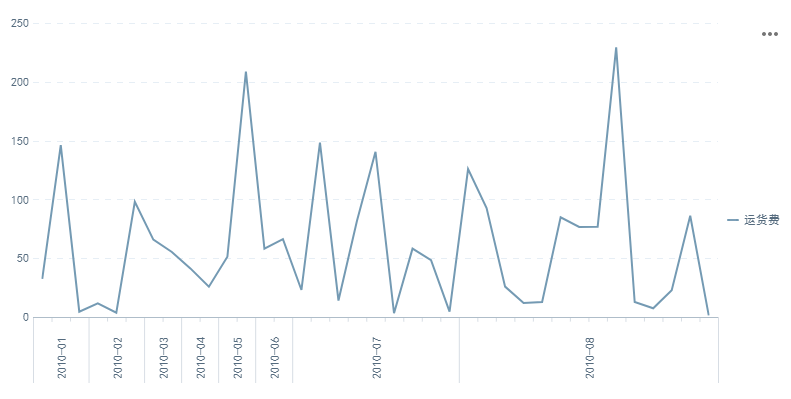
例如:X轴 绑定「年月」和「年月日」字段,但显示时,坐标轴只需要显示「年月」,折线图要以「年月日」维度查看数据。如下图所示:
1.2 实现思路
通过轴标签格式自定义使用 JavaScript 代码实现。判断分类轴内容的长度,使其大于某个长度时显示为空。
注:适用于不同分类长度均不同的情况。
2.1 数据准备
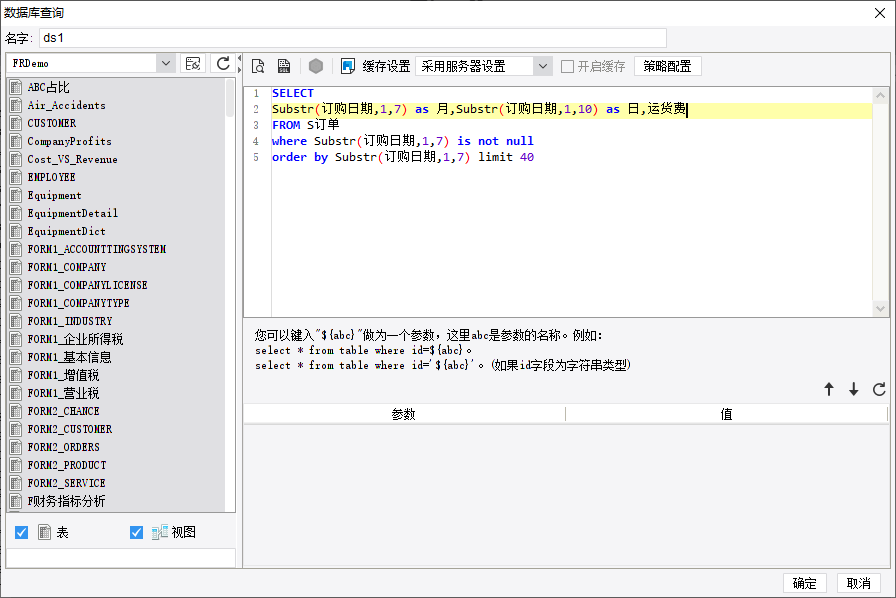
新建普通报表,新建数据库查询 ds1 ,SQL 查询语句为:
SELECT
Substr(订购日期,1,7) as 月,Substr(订购日期,1,10) as 日,运货费
FROM S订单
where Substr(订购日期,1,7) is not null
order by Substr(订购日期,1,7) limit 40
2.2 报表设计
2.2.1 插入折线图
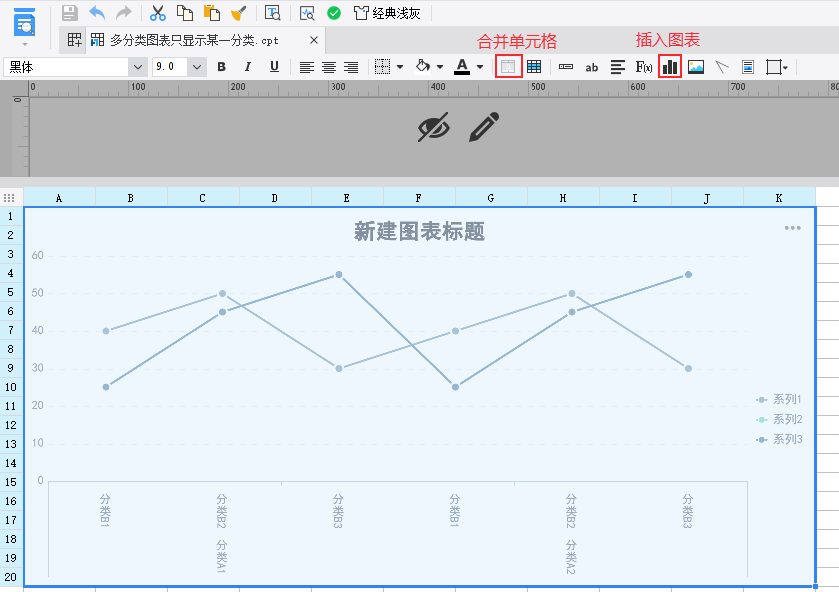
选中一片单元格区域,合并单元格后,插入「折线图」。如下图所示:
2.2.2 绑定图表数据
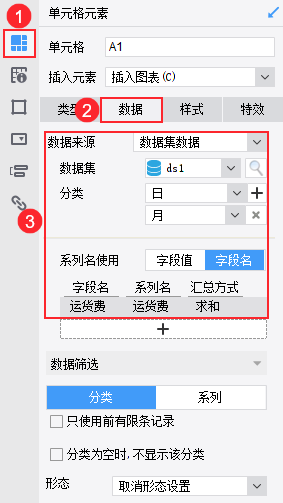
选中图表,点击「单元格元素>数据」,绑定图表数据如下图所示:
2.2.3 设置坐标轴标签
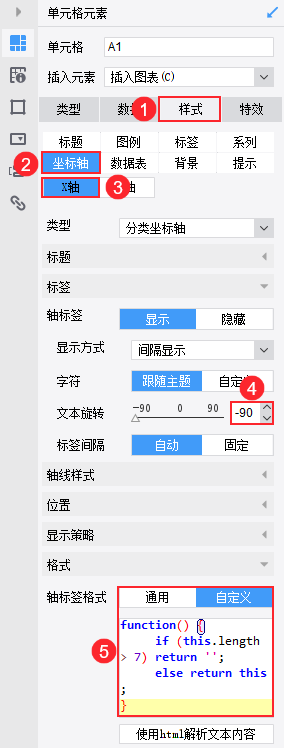
点击「样式>坐标轴>X轴」,设置「标签>文本旋转」为 -90 ,轴标签格式选择「自定义」,输入代码如下:
function() {
	if (this.length > 7) return '';
	// 当分类轴内容长度大于7时,返回空,实现隐藏
	else return this;
}
2.3 效果预览
2.3.1 PC 端
保存报表,点击「分页预览」,效果如下图所示:
2.3.2 移动端
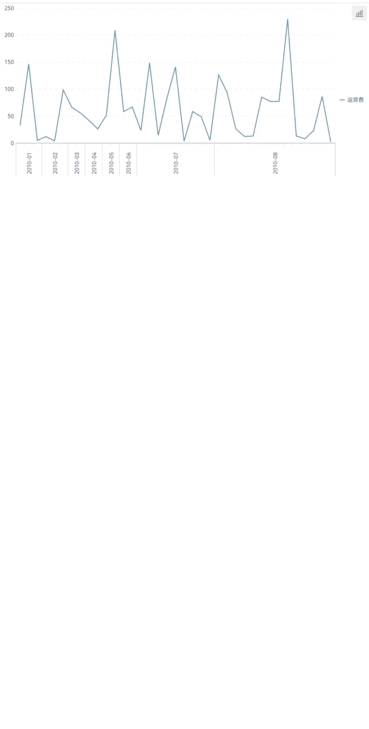
App 端和 HTML5 端均支持,效果如下图所示:
3. 模板下载
 多分类图表实现分类轴某分类隐藏.rar (4.31 K)